Facebook
Instagram
X
Tiktok
LinkedIn
YouTube
Email Signup
RSS Feed
The Crimson White
Search this site
Submit Search
Menu
NEWS
SPORTS
CULTURE
OPINION
SUBMIT AN OPINION
MULTIMEDIA
PHOTO
VIDEO
CARTOONS
PODCASTS
CURRENT PRINT ISSUE
PRINT ARCHIVES
NEWSLETTER
APPLY
ABOUT
HISTORY
PAST EDITORS
CURRENT STAFF
ADVERTISE
TIPS
DONATE
MORE
NEWSSTANDS MAP
STUDENT MEDIA STORE
REQUESTS FOR REMOVAL
STAFF DEMOGRAPHICS
APARTMENTS NEAR UA
More
The Crimson White
Open Search Bar
Search this site
Submit Search
Staff Demographics Fall 2021
Editor Demographics
Staff Demographics
Raw Data
Editors Data
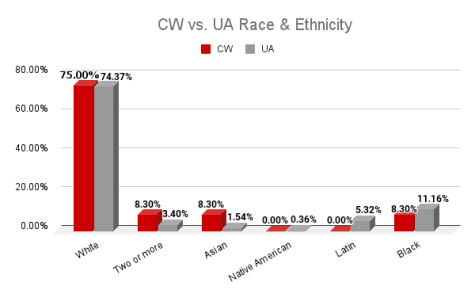
Race
CW
UA
Black
8.30%
11.16%
Latin
0.00%
5.32%
Native American
0.00%
0.36%
Asian
8.30%
1.54%
Two or more
8.30%
3.40%
White
75%
74.37%
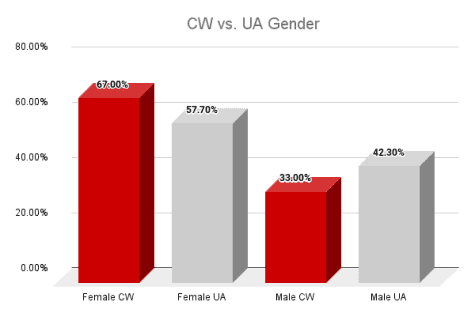
Gender
CW
UA
Female
67%
57.70%
Men
33%
42.30%
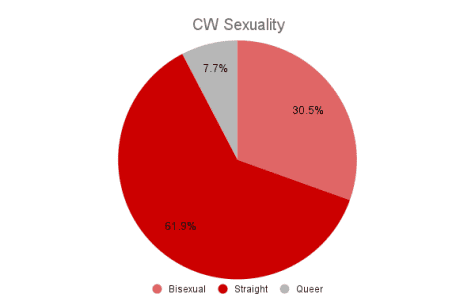
Sexuality
Bisexual
33%
Straight
67%
Queer
8.30%
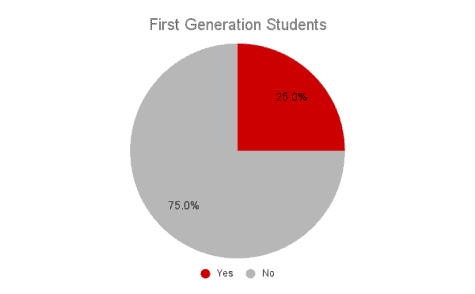
First Generation
Yes
25%
No
75%
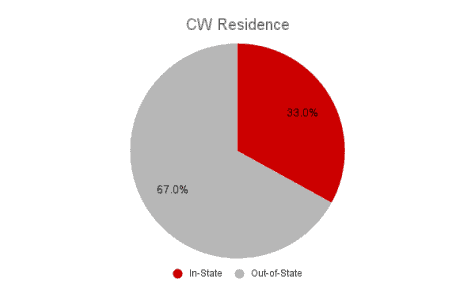
Residence
In-State
33%
Out-of-State
67%
Staff Data
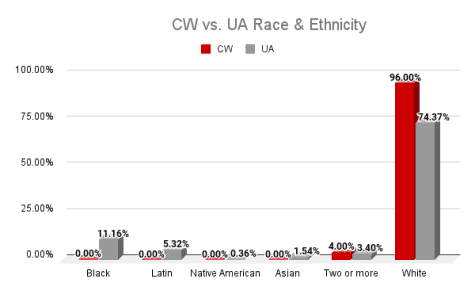
Race
CW
UA
Black
0.00%
11.16%
Latin
0.00%
5.32%
Native American
0.00%
0.36%
Asian
0.00%
1.54%
Two or more
4.00%
3.40%
White
96%
74.37%
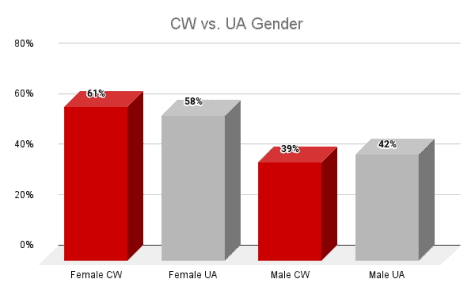
Gender
CW
UA
Female
61.00%
57.70%
Men
39%
42.30%
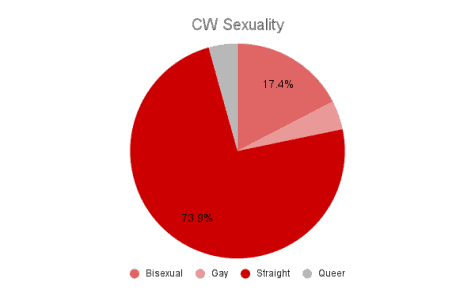
Sexuality
Bisexual
17.40%
Gay
4.34%
Straight
73.90%
Queer
4.34%
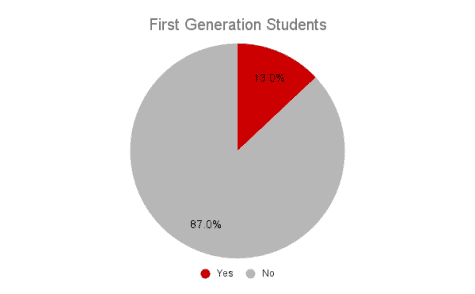
First Generation
Yes
13%
No
87%
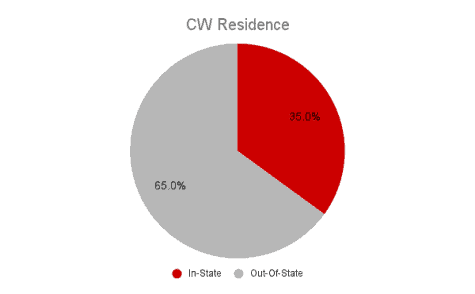
Residence
In-State
35%
Out-Of-State
65%
Close
Close Modal Window
Close