Analysis: COVID-19 dashboard is a ‘good start’ but lacks consistency
September 4, 2020
The UA System COVID-19 Dashboard will be updated Friday, Sep. 4 in its third data log since its launch ten days ago. This update coincides with the deadline for tuition payment or enrollment in a payment plan for the fall semester, which has been noted among groups like Safe Return UA.
Schedules will be cancelled for students who haven’t made their payments before noon. New data will be posted to the dashboard in the evening if consistent with its previous updates.
While the rise in cases has prompted some students to pack their bags and learn remotely from their home towns, others have chosen to drop out completely – before they’d have to pay tuition on Sep. 4.
“I can’t afford to go here if they’re gonna send us home,” freshman Amalia Halpin told The Crimson White after being forced to leave her dorm to make room for COVID-19 isolation space. “It’s super unfortunate, but I had to drop out of college for it. This has been an absolute disaster.”
The Plan
In a Faculty Senate meeting on Aug. 18, President Stuart Bell and Provost James Dalton were asked if UA’s COVID-19 testing data would be public and accessible. They were unable to disclose details on a plan less than 24 hours before the first in-person class of the semester.
Kellee Reinhart, the spokesperson for The University of Alabama System, said a detailed data dashboard has been part of the System’s comprehensive plan since April.
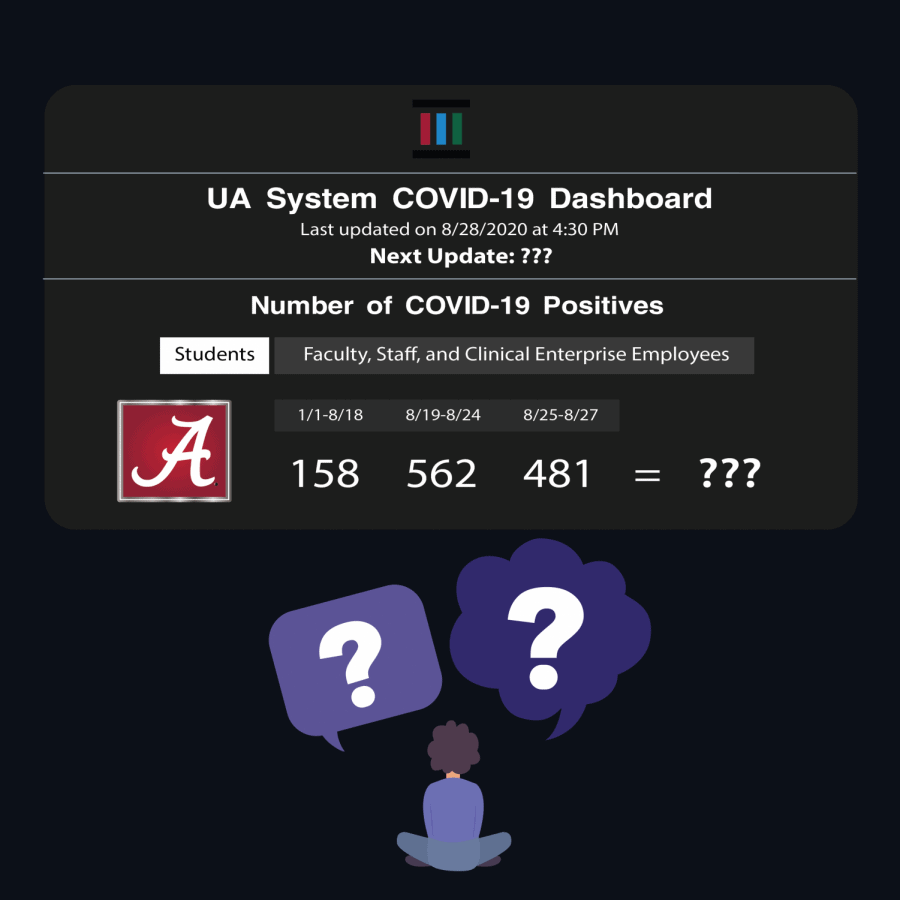
The UA System COVID-19 Dashboard was published on Monday, Aug. 24. Between the first day of classes and the dashboard being published five days later, it listed 531 cumulative cases for students, faculty and staff.
A note of clarification on the meaning of “cumulative cases” explained that only positive tests “identified through sentinel testing, point of care testing in campus health centers, and self reported tests from private providers” were included in this figure. In other words, entry testing did not contribute to the average of 100 new cases per day.
Changes
In subsequent reports, dates were added for clarification. This was one of several changes to the dashboard.
The numbers are now divided into two charts: students and employees. Reinhart said the change was made at the request of faculty members for purposes of clarity and transparency.
On Aug. 24, it listed 531 cumulative cases for students, faculty and staff since the start of the semester. The dashboard now lists 562 positive tests among students alone for the same range of dates.
Some speculated it was a tactic to minimize concern about the influx of cases. Others assumed the discrepancy was the result of private tests conducted during that range of dates that weren’t reported to the University until after the dashboard was updated. Reinhart said it was the latter.
“Our data is always evolving,” she said. “The data on the dashboard is a snapshot of positive cases at the time of reporting.”
Lag in Reporting
The self reported cases from external entities can lead to a lag in reporting to the dashboard.
David Marconnet with BamaTracker.com said this is a problem he has observed at the state level when the Alabama Department of Public Health receives backlogged results from labs.
“I believe transparency is key or else people start speculating,” he said. “I think it would be great if the case totals also included the actual date timestamp with them for the most accurate reporting, but that may be more detailed than they want to share.”
Marconnet said the dashboard would be strengthened with the inclusion of details like the number of tests reported along with the positive cases in each range of dates.
The language used to report these numbers has also changed. It was initially reported as “cumulative cases,” but later referred to as “positive tests.” While a minor change, some believe it indicates the University’s lack of preparation for a method of data collection and delivery.
“We made the change for two reasons,” Reinhart said. “Cumulative cases represented one comprehensive number. When we broke it out by date range, it would have been inappropriate to call the numbers on the chart ‘cumulative.’ The reference was also changed because we are now reporting student and employee cases separately.”
Isolation Capacity
When the dashboard went live, it also listed the occupancy of isolation spaces for COVID-19 positive students. This was several days after an administrator was quoted saying, “If we increase at the rate we did this week, give us a week and a half and we’re going to be at full capacity.”
About one-fifth of isolation spaces were occupied when the dashboard was published on Aug. 24. This included spaces at the Highlands and Bryce Lawn Apartments, two on-campus apartments repurposed as isolation facilities at the end of the summer. Most of its residents relocated to an off-campus apartment complex to free up at least 450 beds for students to quarantine.
On the same day that the 20% occupancy rate was reported, students living in Burke West Residence Hall were given less than two days notice to relocate to other dorms on campus. The consolidation of on-campus students was an effort to carve out more on-campus isolation options as cases continued to rise.
By the dashboard’s second update, the occupancy of isolation spaces had reached 36%. Reinhart confirmed that the percentage included the addition of new spaces in Burke West, but the dashboard didn’t specify this change.
Updates
Reinhart said there are no plans to increase the frequency of reporting. Weekly updates will continue as sentinel testing begins.
Marconnet said he believes it’s reasonable to update weekly, contingent on its consistency.
“Daily data is hard and requires a lot of resources to do effectively,” he said. “It would be best if the time frame of each report is the same and reported consistently.”
The dashboard was posted on a Monday evening and updated again on Friday. Reinhart confirmed that it will continue with weekly updates on Fridays as the University enters its process of sentinel testing.
Marconnet called the dashboard “a good start.”
“With a little more work and effort in explaining everything they are doing from the school’s perspective, it will be a very good resource in the near future.”